Published versions of the Dyson profitability multipliers do not match exactly
WarningBrand Strategy
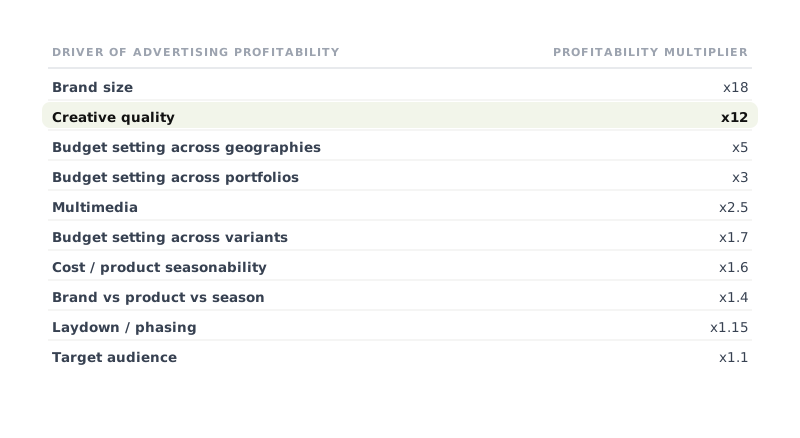
The Dyson profitability multipliers also differ between published versions. Kantar shows brand size at 18 and brand versus product versus season at 1.4; the version reproduced in Google's Effectiveness Equation shows 20 and 2.0. Check which cut you are quoting before it reaches a slide.
Source
10 Charts to Make You a More Effective Marketer, 2026 Edition - Kantar UK Marketing Effectiveness Practice (2026)
Kantar UK Marketing Effectiveness Practice; foreword by Simon Atherley, Head of Marketing Effectiveness
Chart 06, p. 12, 10 Charts 2026 (Kantar UK), compared against Table 1, The Effectiveness Equation (Google, 2025)
Go to the originalMore from this source
StatMarketers and CFOs disagree by 28 points about whether marketing drives long-term growthStatStrong brands outperformed both the S&P 500 and the MSCI World index over nineteen yearsStatConsumer predisposition pays in volume, growth and price simultaneouslyStatPricing power comes overwhelmingly from meaningful difference rather than salienceStatBrands with strong pricing power are measurably more resilient to price increasesStatCreative quality is the largest profitability multiplier a marketer can actually changeStatStrong creative content returns four times the marketing investment behind itStatPaid media accounts for under a third of what builds brand equityStatWell-branded creator content delivers over 60% more brand impact than weakly branded contentWarningNearly three quarters of creator content fails to link back to the brand paying for itStatIntegration lifts brand impact by 30%, integration plus channel customisation by 57%StatThe share of brand impact created by channels working together has more than doubled since 2014