INEC: Live Logo
INEC faced a perception problem: citizens viewed their data as cold, bureaucratic, and irrelevant. Maruri Grey was tasked with rebranding the institute to appear more transparent and human-centric. The goal was to make national statistics feel meaningful to everyday Ecuadorians, especially as the country sought clear information on recovery efforts following the 2016 earthquake.
Creative Idea
Linked a government logo to live databases, turning static branding into real-time data visualization.
INEC transformed its static identity into a dynamic "Live Logo" powered by real-time national data. By visualizing statistics through shifting shapes and colors, the campaign humanized cold government metrics and turned a bureaucratic institution into a transparent, living reflection of society.
The Government Logo That Learned To Breathe
Connecting the API to the Brand
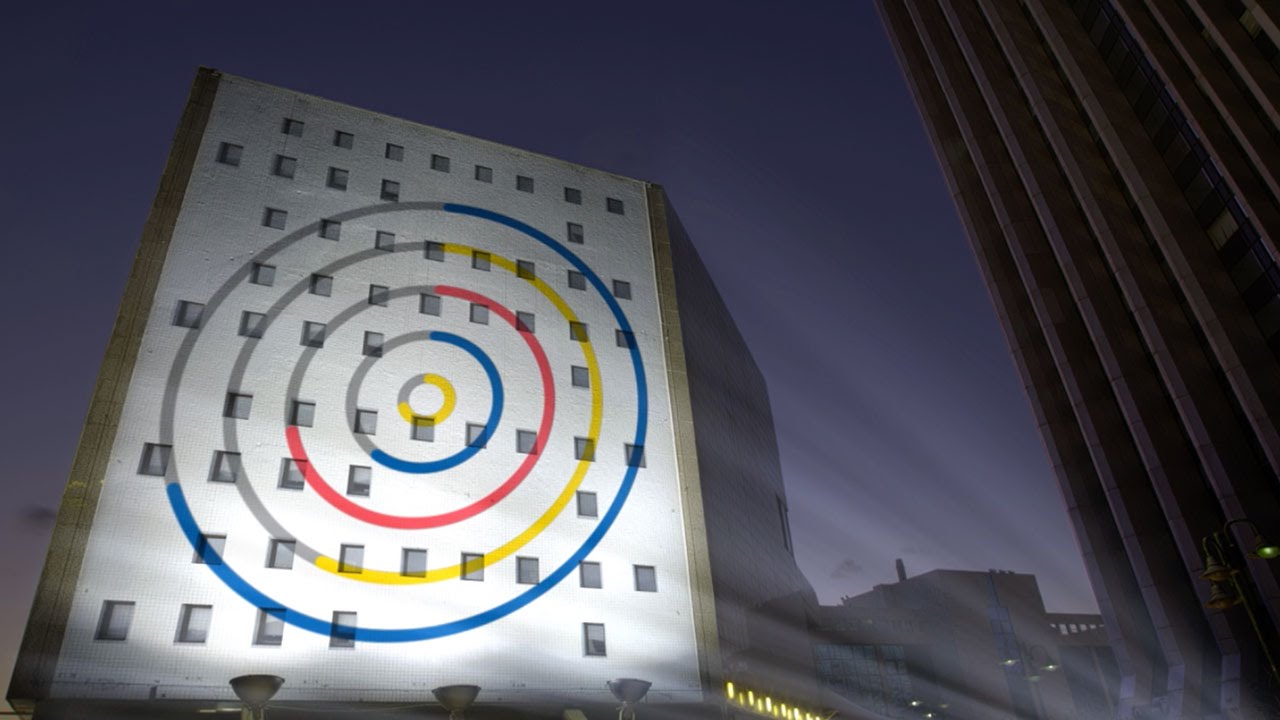
The technical backbone of the project involved a custom API that bridged the gap between INEC’s internal databases and its visual identity. The agency moved away from static design by assigning specific metrics to the logo’s colored circles. Each circle’s size and intensity fluctuated based on live indicators such as water quality, education rates, and housing access. This meant that whenever a statistician verified a new data point, the branding on digital billboards and social media headers updated automatically, ensuring the visual identity was never the same two minutes apart.
Resilience in the Wake of Disaster
 The campaign’s significance deepened following the 7.8 magnitude earthquake that struck Ecuador in April 2016. Maruri Grey and brand leader Luis Campoverde pivoted the data streams to visualize reconstruction progress. By showing the "state of mind" of the nation through shifting colors, the logo became a symbol of transparency and resilience rather than just a bureaucratic tool. This pivot helped shift public perception of INEC from a cold, data-gathering office to a human-centric institution.
A Landmark for Creative Data
The project was a pioneer for Latin American advertising, proving that "big data" could be a creative medium. Eduardo Maruri noted that the goal was to "ennoble the name of Ecuador" by demonstrating that complex government metrics could be simplified into a massive, public-facing dashboard. The success of the "Live Logo" contributed to Maruri Grey being named the Most Creative Agency in Ecuador in 2016, marking a rare moment where a government rebranding project achieved the same cultural cut-through as major consumer goods.
Creative Strategy Deconstructed
Company
Access to massive, real-time national databases covering every aspect of Ecuadorian life and recovery.
Category
Government agencies typically present data through static, boring reports that feel disconnected from the citizens they represent.
Customer
Citizens viewed statistics as bureaucratic noise rather than a reflection of their own lives and progress.
Culture
A national desire for transparency and hope emerged following the devastating 2016 earthquake.
Company
Access to massive, real-time national databases covering every aspect of Ecuadorian life and recovery.
Category
Government agencies typically present data through static, boring reports that feel disconnected from the citizens they represent.
Strategy:
Humanize abstract institutional metrics by transforming them into a dynamic, living reflection of collective reality.
Customer
Citizens viewed statistics as bureaucratic noise rather than a reflection of their own lives and progress.
Culture
A national desire for transparency and hope emerged following the devastating 2016 earthquake.
Strategy:
Humanize abstract institutional metrics by transforming them into a dynamic, living reflection of collective reality.
Results
The campaign achieved significant industry and social impact, notably winning a Gold Lion in Creative Data (Data Visualization) and being Shortlisted in Design at the 2016 Cannes Lions. It was a primary factor in Maruri Grey being named the Most Creative Agency in Ecuador and one of the top 12 in Ibero-America that year. Locally, it secured multiple Gold awards at the Premios Cóndor de Oro and was a finalist in Media and Direct at El Ojo de Iberoamérica. Beyond awards, the campaign successfully transformed INEC's perception from a 'cold' bureaucratic office to a transparent, human-centric institution. Technically, it integrated a custom API across all digital platforms, digital billboards, and social media, allowing for real-time updates that ensured the brand identity was never the same two minutes apart. Following the 7.8 magnitude earthquake, the logo was used to visualize reconstruction progress, serving as a national symbol of transparency and resilience.
1st
Latin American Gold Lion in Creative Data
Top 12
Most Creative Agencies in Ibero-America
100%
Real-time data integration across digital platforms
Strategy Technique
Turn Data Into Drama
By animating abstract statistics into a breathing visual identity, INEC shifted public perception from a cold data-gathering office to a human-centric institution that reflects the nation's pulse in real-time.
Explore Technique
Creative Technique
Real-Time Relevance
The campaign used a custom API to link internal databases directly to the brand's visual identity. This ensured the logo updated instantly with every new statistic, making the data feel immediate and alive.
Explore Technique
Craft Breakdown
The campaign masterfully bridges the gap between cold analytics and human emotion by turning abstract data into a living, breathing visual language.
The project pioneered the use of live government metrics to dictate the aesthetic properties of a brand's visual identity in real-time.
A custom API was developed to bridge massive internal databases with public-facing digital assets, ensuring seamless synchronization.
The minimalist circular geometry of the logo allowed for complex data to be interpreted intuitively through size, color, and movement.
The execution across digital billboards and social headers transformed static advertising spaces into functional, live dashboards.
“The magic lies in the intersection of high-level data engineering and minimalist design, turning a bureaucratic requirement into a dynamic piece of performance art.”