TAM SAM SOM
How to Size a Market Without Lying to Yourself
TAM SAM SOM is the most-faked slide in business. Every pitch deck has one, and a surprising number of them follow the same recipe: find the biggest number a research report ever printed, put it in the outer circle, then claim that "we only need 1% of it". One percent sounds humble. It is usually the least humble sentence in the deck, because nobody has explained who that 1% is, why they would switch and how you would reach them.
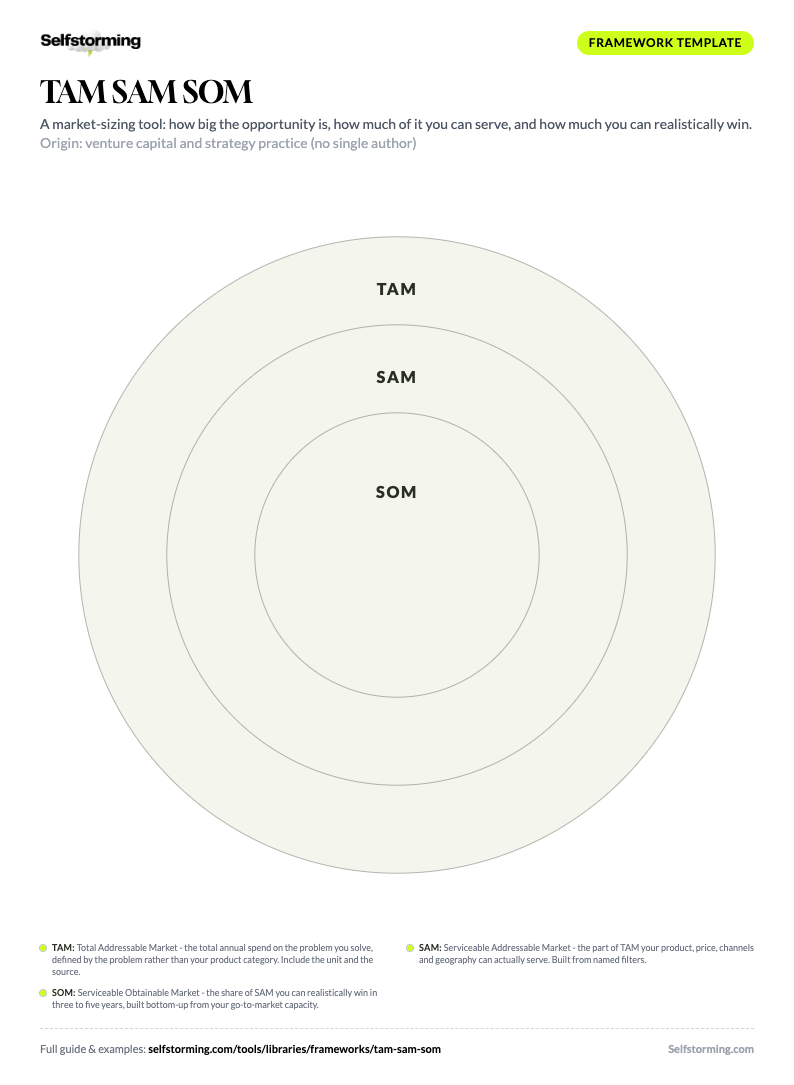
Print it. Fill it in.
The TAM SAM SOM as a printable A4 worksheet - write straight into the framework, on paper or in any PDF app.
Download the PDF templateKnowledge Worth Paying For
A working library of brand strategy frameworks - with worked examples on real brands, sources, and decision criteria. Not vibes.
One good deck covers the subscription. The rest is profit.
Three nested circles, outside in: TAM (Total Addressable Market - everyone with the problem × what they spend on it per year), SAM (Serviceable Addressable Market - the part of TAM your product, price, channels and geography can actually reach), and SOM (Serviceable Obtainable Market - the share of SAM you can realistically win in three to five years). The rule that separates a credible sizing from a fantasy: build SOM bottom-up from things you can count (customers, outlets, sales capacity, conversion), not top-down as "a small percentage of a big number". Use top-down only as a cross-check.
Airbnb
Travel marketplace (USA, seed round in 2008)The most famous market-size slide in startup history. In the widely shared version of the 2008 seed deck, Airbnb sized its market by trips, not by revenue, and filtered SAM by behaviour - people who book online and care about price - rather than by geography. Reproductions of the deck vary slightly, but this is the version most often quoted. The lesson that came later is just as useful: Airbnb grew well beyond "budget" travel, so its real TAM turned out to be bigger than the outer circle on the slide.

Liquid Death
Canned water brand (USA, launched 2019) - illustrative sizingAn illustrative sizing to show how a consumer brand should build SOM: from shelf space and rate of sale, not from a percentage of the water aisle. The figures are rounded teaching assumptions, not company data. The useful move is the SAM, which is defined by occasion and channel - impulse cans in convenience stores, bars and venues - rather than by "everyone who drinks water".

Notion
B2B productivity software (USA, founded 2013) - illustrative sizingAn illustrative B2B sizing that shows how SAM can be defined by buying behaviour. Notion's early growth came from teams adopting it bottom-up, without an IT procurement process, so the serviceable market is not "every company" but teams that can choose their own tools. The figures are structure, not company data: the point is the formula in the SOM.
Airbnb, Liquid Death, Notion - filled in, line by line. Unlock to read them.
Airbnb (Travel marketplace (USA, seed round in 2008))
The most famous market-size slide in startup history. In the widely shared version of the 2008 seed deck, Airbnb sized its market by trips, not by revenue, and filtered SAM by behaviour - people who book online and care about price - rather than by geography. Reproductions of the deck vary slightly, but this is the version most often quoted. The lesson that came later is just as useful: Airbnb grew well beyond "budget" travel, so its real TAM turned out to be bigger than the outer circle on the slide.
TAM: 2 billion+ trips booked worldwide per year - every stay, hotels and hostels included.
SAM: 560 million budget and online trips - travellers who book online and care about price.
SOM: 84 million trips booked on Airbnb - a 15% share of the serviceable market.
Liquid Death (Canned water brand (USA, launched 2019) - illustrative sizing)
An illustrative sizing to show how a consumer brand should build SOM: from shelf space and rate of sale, not from a percentage of the water aisle. The figures are rounded teaching assumptions, not company data. The useful move is the SAM, which is defined by occasion and channel - impulse cans in convenience stores, bars and venues - rather than by "everyone who drinks water".
TAM: All US packaged-water spend - tens of billions of dollars a year.
SAM: Premium single-serve water bought on impulse in convenience stores, bars and venues by 21-40s.
SOM: Bottom-up: outlets won in 3 years × cans sold per outlet per week × price - hundreds of millions, not a share of the aisle.
Notion (B2B productivity software (USA, founded 2013) - illustrative sizing)
An illustrative B2B sizing that shows how SAM can be defined by buying behaviour. Notion's early growth came from teams adopting it bottom-up, without an IT procurement process, so the serviceable market is not "every company" but teams that can choose their own tools. The figures are structure, not company data: the point is the formula in the SOM.
TAM: Every knowledge worker who writes docs, wikis and project plans - hundreds of millions of seats worldwide.
SAM: Teams of 5-200 in tech-forward companies that pick their own tools without IT procurement.
SOM: Teams reachable via templates, word of mouth and a free plan × free-to-paid conversion × price per seat.
1. SOM
Given real competitors and our actual go-to-market capacity, how much of SAM can we win in the next three to five years?
Serviceable Obtainable Market. The inner circle and the only number that behaves like a target. SOM is the revenue or customer count you can realistically capture with your current team, budget, distribution and conversion rates, against competitors who will not stand still. Build it bottom-up: reachable customers × conversion × purchase frequency × price, or outlets × rate of sale × price. Then express it as a share of SAM to check it is believable.
Good answer: 40 field reps × 25 new accounts each per year × €18k average contract = €18M new ARR in year three, about 3% of SAM. Every input can be challenged and defended, which is the point. The percentage comes last, as a sanity check.
Wrong answer: "If we capture just 1% of SAM, that is $500M." The 1% is a wish, not a calculation. It hides the questions that matter - who those customers are, why they switch, what it costs to reach them - and it tells a reader you started from the answer you wanted.
2. SAM
Which part of that demand can our product, at our price, through our channels and in our geography, actually serve?
Serviceable Addressable Market. The middle circle: the slice of TAM that fits your business model today. Filter TAM by everything that limits who you can serve - geography and language, price point, channel, customer size, regulation, and the behaviour your product assumes. SAM is where market sizing turns into strategy, because every filter is a choice about who you are for. If the SAM barely shrinks compared with TAM, you have not made any choices yet.
Good answer: Premium single-serve water sold in convenience stores, bars and venues to 21-40-year-olds. Price, channel and occasion all narrow the market. A buyer of 24-packs at a warehouse club is in the TAM but nowhere near this SAM, and pretending otherwise inflates the number.
Wrong answer: SAM = TAM × 30% "because that is our target region". A percentage with no reasoning behind it. SAM should be built from filters you can name - who buys online, who can afford the price, where you can deliver - not from a round number that makes the chart look balanced.
3. TAM
If every person or company with this problem paid to solve it today, how much would they spend in a year?
Total Addressable Market. The outer circle: the total annual demand for the problem you solve, regardless of who currently solves it or how. Define it by the problem, not by your product category - a meal-kit brand competes for "weeknight dinners", not just for "meal kits". TAM tells investors and leadership whether the prize is worth the effort. It does not tell anyone how much of it you can have.
Good answer: Every trip anyone books worldwide in a year - hotels, hostels, B&Bs, the lot. (Airbnb's 2008 outer circle.) Defined by the job travellers hire a bed for, not by the tiny "rent a stranger's air mattress" category that existed at the time.
Wrong answer: "The global wellness market is worth $5 trillion." A real number, borrowed from a report, that includes gyms, spa holidays and organic carrots. If a sports-nutrition startup puts it in the outer circle, the slide is not ambitious - it is lazy, and every reader can tell.
Decide your starting point: You do not have to start from a blank spreadsheet and a search bar. On Selfstorming you can run a Research Session to gather category data, competitors and sources first, then use the steps below to turn those inputs into three numbers you can defend. Treat any first figure, from a report or from AI, as a hypothesis to check, not a fact to paste.
Define the problem before the market: Write one sentence about the problem you solve, in the customer's words. "People need a place to stay when they travel" sizes a different market than "people want cheap alternatives to hotels". Your TAM is the spend on that problem, whichever category currently takes the money.
Size TAM two ways: Do a top-down estimate from a credible source (industry body, public filings, government statistics) and a bottom-up estimate (number of customers with the problem × annual spend). If the two are an order of magnitude apart, one of your assumptions is wrong. Find it before anyone else does.
Build SAM from named filters: List every constraint that limits who you can serve - countries and languages, price point, channel, customer size, regulation, required behaviour (for example "books travel online"). Apply them one at a time and write each filter next to the number it produces. A SAM without visible filters will be challenged.
Build SOM bottom-up from capacity: Start from what you can actually do. For B2B: reps × accounts per rep × contract value. For consumer brands: outlets or reachable customers × conversion or rate of sale × price × purchase frequency. Use conservative conversion rates from your own data or comparable companies, not the best case.
Sanity-check SOM against SAM and competitors: Express SOM as a share of SAM. Low single digits over three to five years is normal for a new entrant; anything above 10-15% needs a reason, such as a distribution deal or no direct competitor. Then look at the largest incumbents - if your SOM is bigger than their current business, explain why.
Show your working: On the slide or in the plan, show the formula and the sources for each circle, not only the three numbers. A reader who can follow the logic will forgive a wrong assumption; a reader who sees three unexplained numbers will assume all of them are wrong.
Revisit it every year: Markets move and so does your capacity. Update the inputs with real conversion and retention data once you have it, and check whether the TAM itself is growing because of you - the best businesses expand the market rather than just taking share of it.
Best for: Sizing an opportunity before a launch, a new market or a fundraise - when leadership or investors need to know how big the prize is and how much of it you can realistically win. / Choosing how to win once you have entered: positioning, offer, brand and creative. The circles size the market; they do not tell you what to say to it.
Output: Three numbers in one unit - TAM, SAM, SOM - each with its formula, filters and sources, plus SOM as a share of SAM. / A market map, a competitor grid or a segmentation. TAM SAM SOM gives you sizes, not the shape of the market.
Time to complete: A rough top-down version in an hour; a defensible bottom-up version in a few days of research and modelling with real conversion and distribution data. / A five-minute slide built from one report figure and a percentage. That version is faster and almost always wrong.
vs SWOT: Use TAM SAM SOM when the question is "how big is the opportunity and how much can we capture?" - it produces numbers. / SWOT maps internal strengths and weaknesses against external opportunities and threats. It tells you whether you are fit to chase the market TAM SAM SOM sized. Run them together.
vs Porter's Five Forces: Use TAM SAM SOM to measure the size of the market and your obtainable share. / Porter's Five Forces tells you how attractive and profitable that market is - buyer power, rivalry, substitutes. A big SOM in a market with brutal rivalry can still be a bad business.
vs Ansoff Matrix: Use TAM SAM SOM to put a number on one specific growth option. / The Ansoff Matrix chooses the type of growth - penetration, market development, product development or diversification. Choose the route with Ansoff, then size it with TAM SAM SOM.
TAM SAM SOM has no single inventor. It grew out of venture capital and strategy practice, where the "market" slide became a fixed part of the startup pitch deck - Sequoia's guide to writing a business plan lists "market potential" as a core section and adds that "some of the best companies invent their own markets". The three circles became the standard shorthand during the 2000s startup boom, and the best-known example is Airbnb's 2008 seed deck, which sized the market by trips: 2 billion+ worldwide, 560 million budget and online trips, and an obtainable 84 million. The framework's most famous argument came in 2014, when NYU professor Aswath Damodaran valued Uber at about $5.9 billion using a $100 billion global taxi TAM and a 10% share, and investor Bill Gurley answered with "How to Miss By a Mile", arguing that Uber was expanding the market rather than taking share of the old one. Both sides used the same three circles. They disagreed about how big the outer one could become.
The strongest critique of TAM SAM SOM is that it is easy to perform and hard to do. Many decks use top-down percentages that produce impressive numbers without a single verifiable input, and experienced investors discount those slides almost entirely. The second critique comes from the opposite direction: the framework assumes a fixed market, so it systematically underestimates businesses that change behaviour. The Damodaran-Gurley exchange about Uber is the standard example - a careful valuation built on the existing taxi market missed how much bigger the market became once cars arrived in minutes. A third problem is definitional: move the TAM from a narrow category to a broad problem and the number changes by orders of magnitude, so the outer circle often says more about the author's ambition than about the market. Used bottom-up, with the formula shown, the framework is a useful discipline. Used as a slide that needs three impressive numbers, it is decoration.
What is TAM SAM SOM?
TAM SAM SOM is a market-sizing framework that splits a market into three nested circles. TAM (Total Addressable Market) is the total demand for the problem you solve. SAM (Serviceable Addressable Market) is the part of it your product, price, channels and geography can actually reach. SOM (Serviceable Obtainable Market) is the share of SAM you can realistically win in the next few years against real competitors. It is the standard market-size slide in startup pitch decks, and a useful sanity check for any launch plan.
How do you calculate TAM, SAM and SOM?
There are two routes. Top-down starts from an industry figure (for example "the global taxi market is $100 billion") and narrows it with percentages. Bottom-up starts from units you can count: number of reachable customers × how often they buy × price. For TAM, multiply everyone who has the problem by what they spend on it per year. For SAM, keep only the customers your product, channels and geography can serve. For SOM, build it from your actual go-to-market capacity - sales reps, distribution points, marketing budget, conversion rates - over a three to five year horizon. Investors trust the bottom-up number more, so lead with it and use top-down as a cross-check.
What is the difference between top-down and bottom-up TAM SAM SOM?
Top-down borrows a big market figure from a research report and slices it ("we only need 1% of a $50 billion market"). It is quick and almost always too optimistic, because the 1% never comes with a plan. Bottom-up multiplies things you can verify: customers you can name or count, purchase frequency and price. It is slower but defensible, and it shows that you understand how customers actually buy. A good TAM SAM SOM slide uses bottom-up for the number and top-down only to show the two methods land in the same neighbourhood.
What is a realistic SOM percentage of SAM?
There is no universal rule, but most credible early-stage SOMs land in the low single digits of SAM over three to five years, and claims above 10-15% need serious evidence such as a distribution deal, a captive customer base or no real competitor. The better question is not "what percentage?" but "what capacity?" - SOM should be the number your sales, distribution and marketing plan can deliver, expressed afterwards as a percentage of SAM.
What is a TAM SAM SOM example?
The best-known one is Airbnb's 2008 seed deck. In the widely shared version, TAM was 2 billion+ trips booked worldwide, SAM was 560 million budget and online trips, and SOM was 84 million trips - a 15% share of the serviceable market. The interesting part is the SAM: Airbnb filtered by behaviour (people who book online and care about price), not just by geography. This page has three worked examples, including a consumer brand sized bottom-up from distribution.
What does PAM mean in PAM TAM SAM SOM?
PAM is the Potential Available Market - an optional fourth, outermost circle used by some investors and analysts. It covers everyone who could theoretically have the problem, including people who do not spend money on solving it today. TAM then becomes the part of PAM that is already paying for some solution. Most decks skip PAM; it is useful when you are creating a new category and today's spend understates the real demand.
Is TAM SAM SOM only for startups and pitch decks?
No. TAM SAM SOM started as pitch-deck shorthand, but it works for any decision about where to grow: a brand entering a new country, a product line extension, a B2B company choosing which vertical to attack first, or a marketing team setting realistic penetration targets. In established brands the most useful circle is usually SAM, because it forces the team to define who it can actually serve before arguing about share.
Is TAM SAM SOM the same as market share?
Not quite. Market share is a backward-looking measure of what you already sell compared with the whole category. SOM is a forward-looking estimate of what you could win, and it is measured against SAM, not the whole market. A brand with a 2% share of the total market can hold a 20% share of its serviceable market - which is often the more honest description of how strong it is where it actually competes.
A market-sizing tool: how big the opportunity is, how much of it you can serve, and how much you can realistically win.
All 50 frameworks, ready to use.
The PDF book with worked examples and printable templates, the editable PowerPoint and an MD file for your AI. €39.90, or free with a yearly plan.
See the ebook packDone properly, the framework is three nested circles that get smaller and more honest as you move in. TAM, the Total Addressable Market, is all the demand for the problem you solve. SAM, the Serviceable Addressable Market, is the part your product, price, channels and geography can actually serve. SOM, the Serviceable Obtainable Market, is the slice you can realistically win in the next few years with the team and budget you have. The outer circle gets you a meeting. The inner one is what you are actually promising. This page covers the three circles, top-down versus bottom-up calculation, the mistakes investors spot in seconds, and worked examples from Airbnb's famous seed deck to a beverage brand sized from its shelf space.
Related Frameworks
Playing to Win
Five linked choices, top to bottom: Winning Aspiration (what winning looks like, for whom), Where to Play (the specific market, segment, geo
OKRs
One Objective (qualitative, ambitious, memorable - the hill worth taking) plus three Key Results (numeric, measurable, with zero grey area -
SWOT Analysis
Four boxes, two axes: Strengths and Weaknesses are internal and controllable, Opportunities and Threats are external and mostly not. Left si
Eisenhower Matrix
Score every task on two axes: important (does it matter to your goals?) and urgent (does it need attention now?). That gives four boxes. Do