Of six brand metrics tested against profit, only preference and pricing power survive. Awareness, consideration, trust and NPS add nothing. What pricing power is and the 1995-vintage recipe for building it.
Open a brand tracking dashboard. Awareness sits in the top row, because it always does. Below it come consideration, trust and net promoter score, each with a small green or red arrow.
James Hurman just ran those metrics against profit in The Funny Thing About Profit, a study of 217 New Zealand campaigns. Four of the six he tested predict nothing. One of the two that do is a metric many trackers do not carry at all.
The two rows that matter
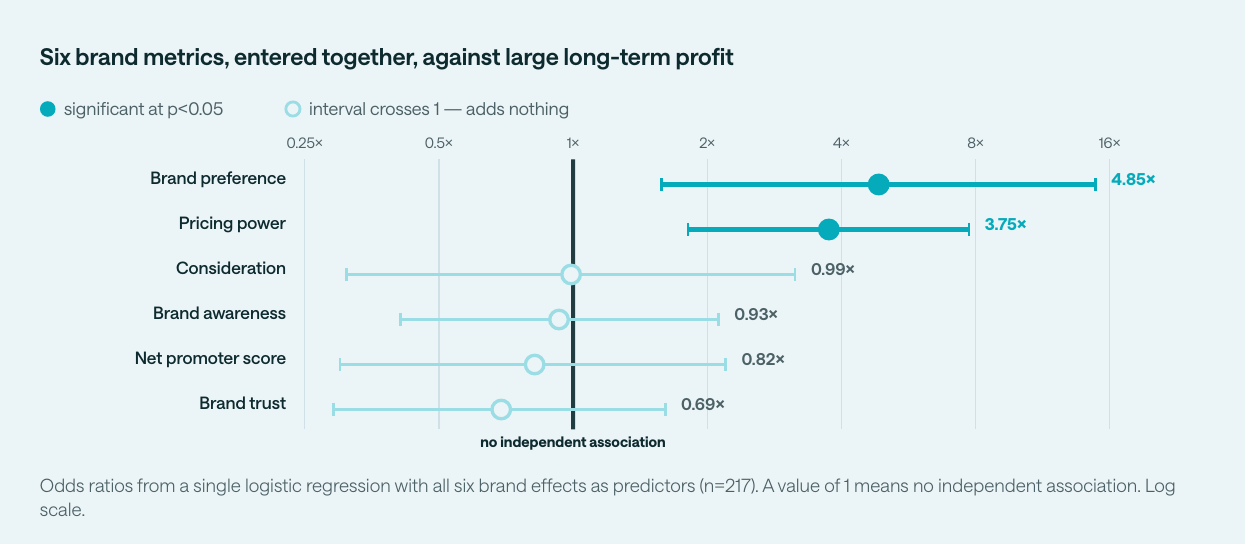
The Aotearoa Effectiveness Database asks entrants to rate six brand effects: awareness, consideration, preference, trust, pricing power and net promoter score. Put all six into one model against long-term profit and four of them disappear.
Source: James Hurman, The Funny Thing About Profit, Aotearoa Effectiveness Database / Commercial Communications Council NZ, 2026
Brand preference carries an odds ratio of 4.85. Pricing power carries 3.75. Consideration lands at 0.99, awareness at 0.93, NPS at 0.82 and trust at 0.69, all statistically indistinguishable from doing nothing.
This is less shocking than it looks. Nearly every campaign in the database reports awareness and consideration, so those metrics cannot tell a profitable campaign from an unprofitable one. Hurman calls them necessary conditions, not sufficient ones. Preference and pricing power are different. One measures your claim on the buyer's choice, the other your claim on their wallet.
What pricing power is
The ability to charge more, or discount less, than you otherwise could.
Advertising can do two things to a demand curve. It can move the curve out, so you sell more units at the same price. Or it can make the curve steeper, so fewer buyers leave when you raise the price or a competitor cuts theirs. The first grows revenue. The second is where the margin lives, because a price you can defend drops almost entirely to the bottom line.
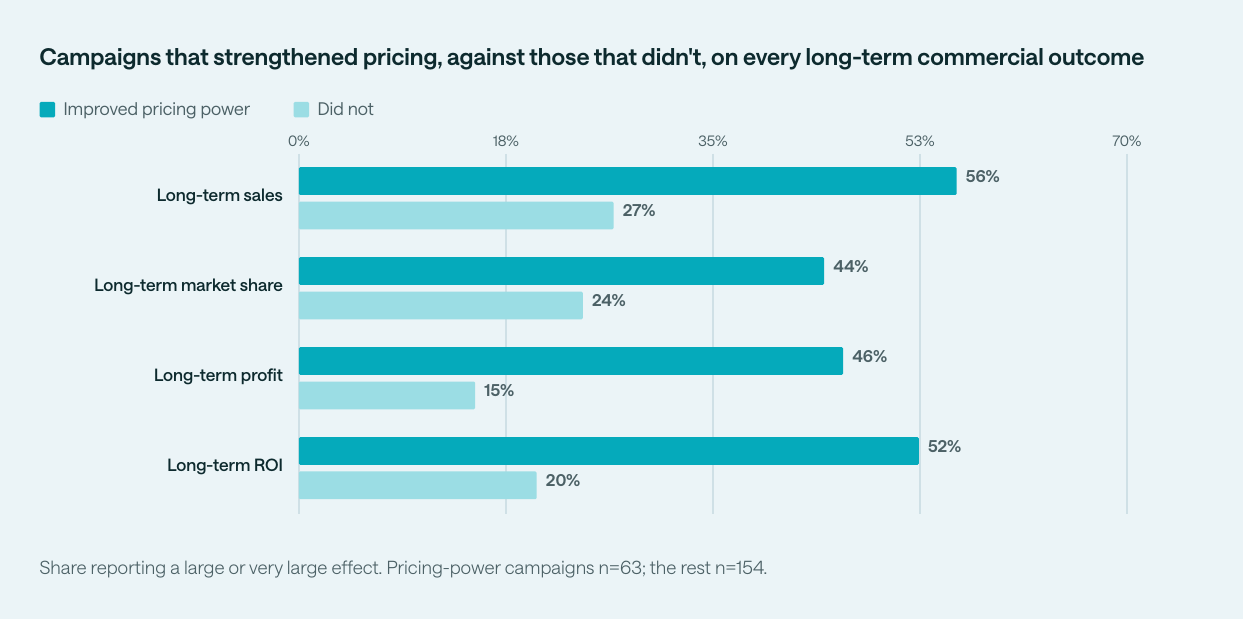
In the database, 63 campaigns (29%) reported a large effect on strengthening or defending price. Those campaigns reported a large long-term profit effect 46% of the time. Everyone else managed 15%.
Source: James Hurman, The Funny Thing About Profit, Aotearoa Effectiveness Database / Commercial Communications Council NZ, 2026
A multiplier, not an engine
Here is the part that should stop anyone from turning this into a "forget growth, build price" slide.
Source: James Hurman, The Funny Thing About Profit, Aotearoa Effectiveness Database / Commercial Communications Council NZ, 2026
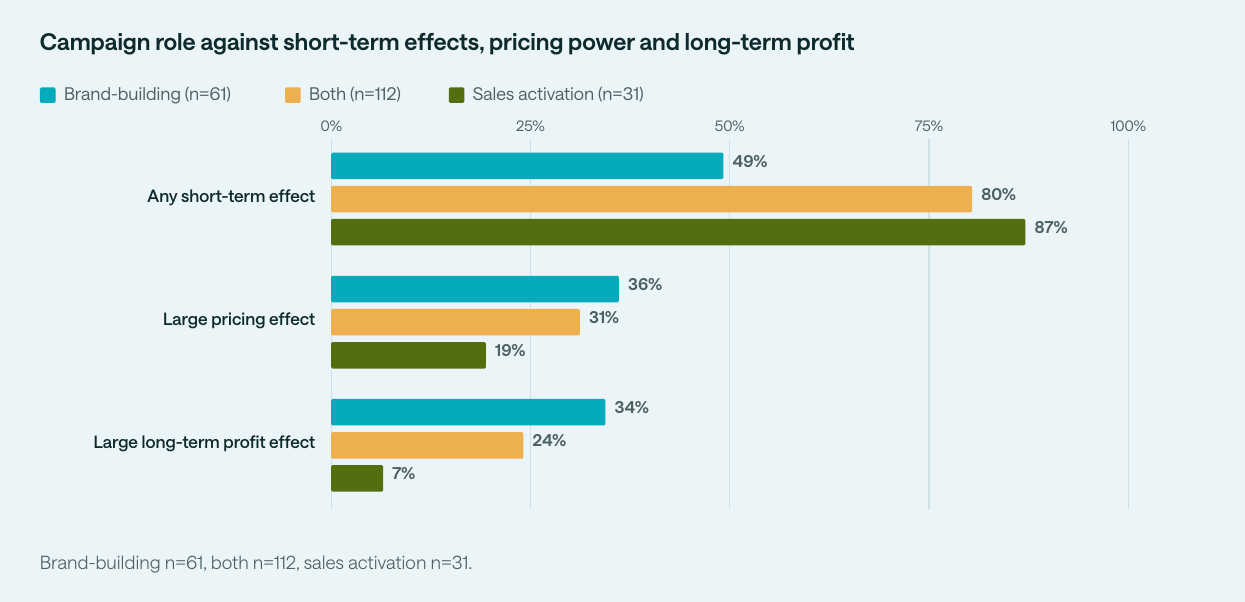
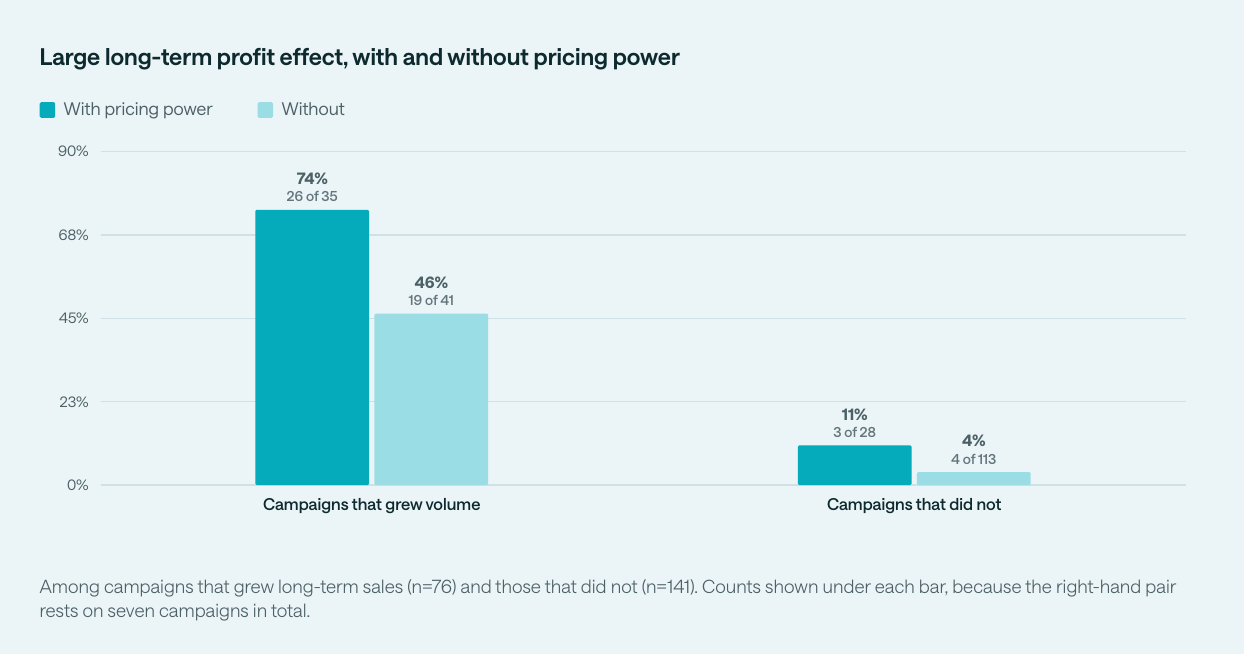
Among campaigns that grew volume, pricing power raises the chance of growing profit from 46% to 74%. Among campaigns that did not grow volume, it raises it from 4% to 11%. That second number is three campaigns out of 28.
Pricing power improves the odds by about the same factor in both groups. A multiple of almost nothing is still almost nothing. In the report's words, it "determines how much of your growth you get to keep". You need the growth first, which is the argument Tom Roach makes for doing both jobs instead of picking a side.
The recipe is embarrassingly old
Hurman tested thirteen creative and media variables against the chance of a large pricing effect. Eight are significant. He notes that the list would have been unremarkable advice in 1995 and sounds almost contrarian now.
Element | With it | Without it |
|---|---|---|
Recurring brand character | 48% | 25% |
World-class craft | 47% | 26% |
Media spend of $1M or more | 43% | 23% |
Television in the mix | 38% | 14% |
Humour | 37% | 22% |
Radio in the mix | 37% | 20% |
Broad targeting | 34% | 13% |
Out-of-home in the mix | 34% | 15% |
Share of campaigns reporting a large pricing effect. Source: The Funny Thing About Profit, 2026
Two things did nothing. Celebrity scored 31% against 29%. Purpose-led work scored 28% against 29%. The report's explanation of the first is ownership. A character is an asset on your balance sheet. A celebrity is a rental who will happily do an ad for your competitor next year.
Craft has a twist. World-class craft reaches 47%. High, moderate and low craft all sit at 28 or 29%. Nothing separates "pretty good" from "fine". Only the top of the scale moves price.
Targeting is the link to everything Byron Sharp has been saying since How Brands Grow. The price you can charge is set by what people who are not buying you think you are worth. Les Binet, looking across more than two thousand IPA cases, has said he found no company that strengthened its pricing power by targeting existing customers.
And then you wait
Source: James Hurman, The Funny Thing About Profit, Aotearoa Effectiveness Database / Commercial Communications Council NZ, 2026
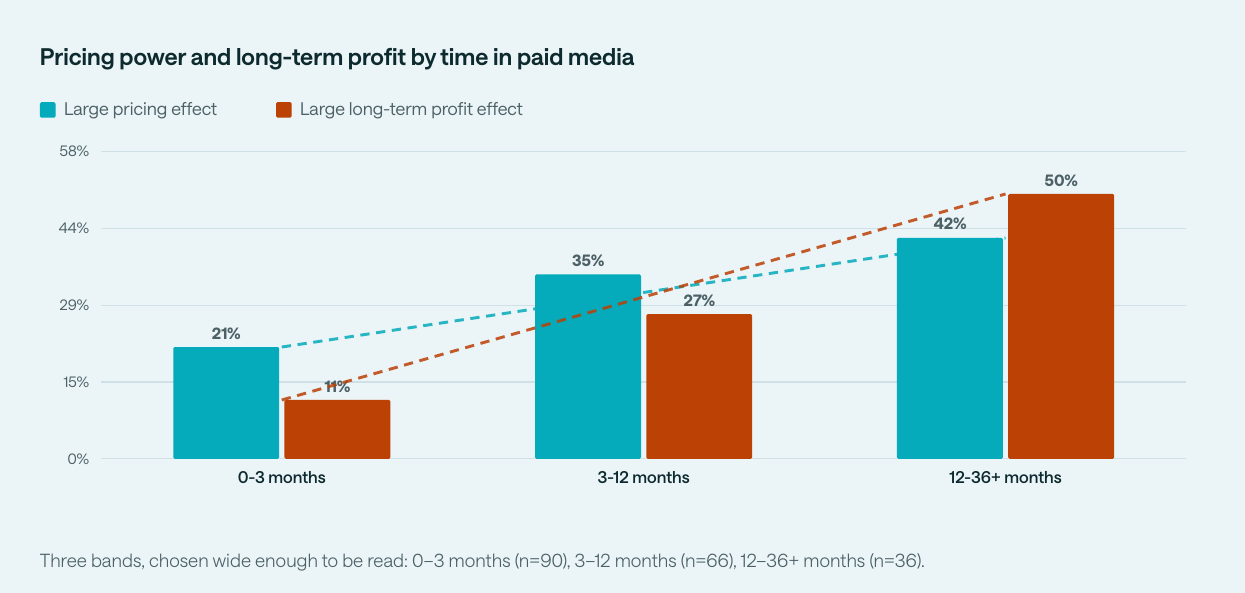
Pricing power is the slowest outcome in the database. Campaigns in paid media for under three months achieved it 21% of the time. Campaigns that ran a year or more achieved it 42% of the time, and their long-term profit rate went from 11% to 50%.
A short campaign can sometimes shift what people will pay. Only a long one gets to collect on it repeatedly.
Who gets to use it
The intuition says pricing power is a premium-brand problem. The data says half of value-priced brands reported a large pricing effect, against 41% of premium brands and 25% of midmarket ones. For a value brand, pricing power can mean escaping the discount cycle. The midmarket is the hard place. A brand with no price story has nothing to defend and nothing to climb towards.
The usual limits apply. These are Effie entrants rating their own campaigns, the model shows association, and some cells are small. The finding also lines up with Binet and Field's IPA work and Kantar's BrandZ numbers, which the report cites, so it is not a lone result from a small country.
If you want one action from all this, it costs a single survey question. Ask your tracker respondents what they would pay for you compared with the brand next to you on the shelf, and put the answer in the top row. The Marketing Wisdom library has the evidence to argue for it when someone asks why awareness got demoted.
Awareness will not mind. It has had a very good run.