WPP Media and Oxford's Saïd Business School analysed 1.2 million purchase journeys. 84% of purchases go to a brand the buyer already favoured. What that means for performance budgets, and how far to trust it.
By the time someone types "best running shoes" into a search bar, the decision is mostly over. They have a brand in mind. They are looking for permission.
That is the claim in How Humans Decide, a white paper from WPP Media and the marketing faculty of Oxford's Saïd Business School. It draws on 1.2 million purchase journeys across more than 200 categories in 47 countries, and it puts a number on something brand people have been saying with their hands for decades.
84% is the number
The paper splits the purchase journey in two. The priming stage is ordinary life. Nobody is shopping, but brand experiences pile up and tilt people towards one name over another, usually without them noticing. The active stage starts when a need shows up and ends at the till. It can last seconds or months.
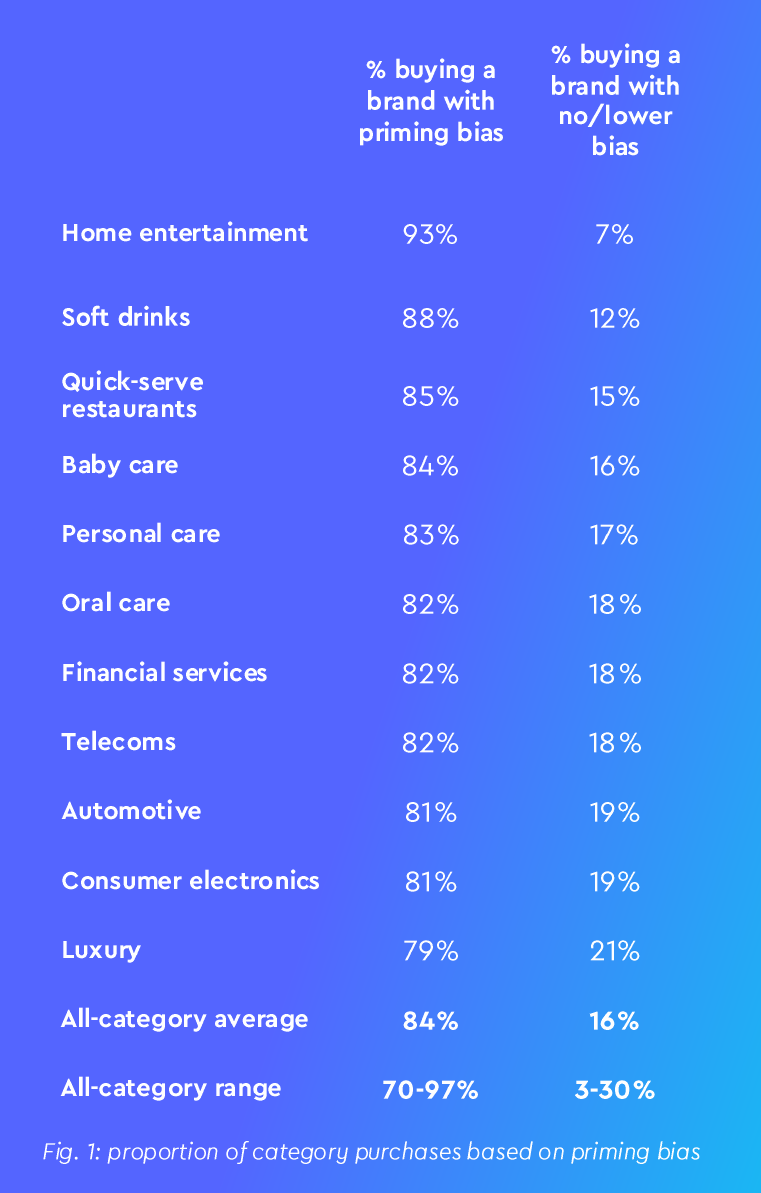
Across all categories, 84% of purchases go to a brand the buyer was already biased towards before the active stage began. The remaining 16% go to a brand with weaker or no prior bias.
Source: How Humans Decide, WPP Media and Saïd Business School, University of Oxford, 2025
You might expect the figure to collapse in considered categories, where people supposedly research. It barely moves. Home entertainment is 93%, soft drinks 88%, automotive and consumer electronics 81%. Luxury is the lowest of the eleven categories shown, at 79%. Across the whole database the range is 70% to 97%.
Shoppers also consider fewer brands than a funnel diagram implies. Typically fewer than three, and they pick the one they were leaning towards.
What that does to the performance budget
If 84% of buyers arrive with a favourite, then a large part of what performance marketing does is convert people who were already coming. The paper says so directly. The 84% are looking for a reason to confirm their choice. The 16% need to hear why your brand is the better one.
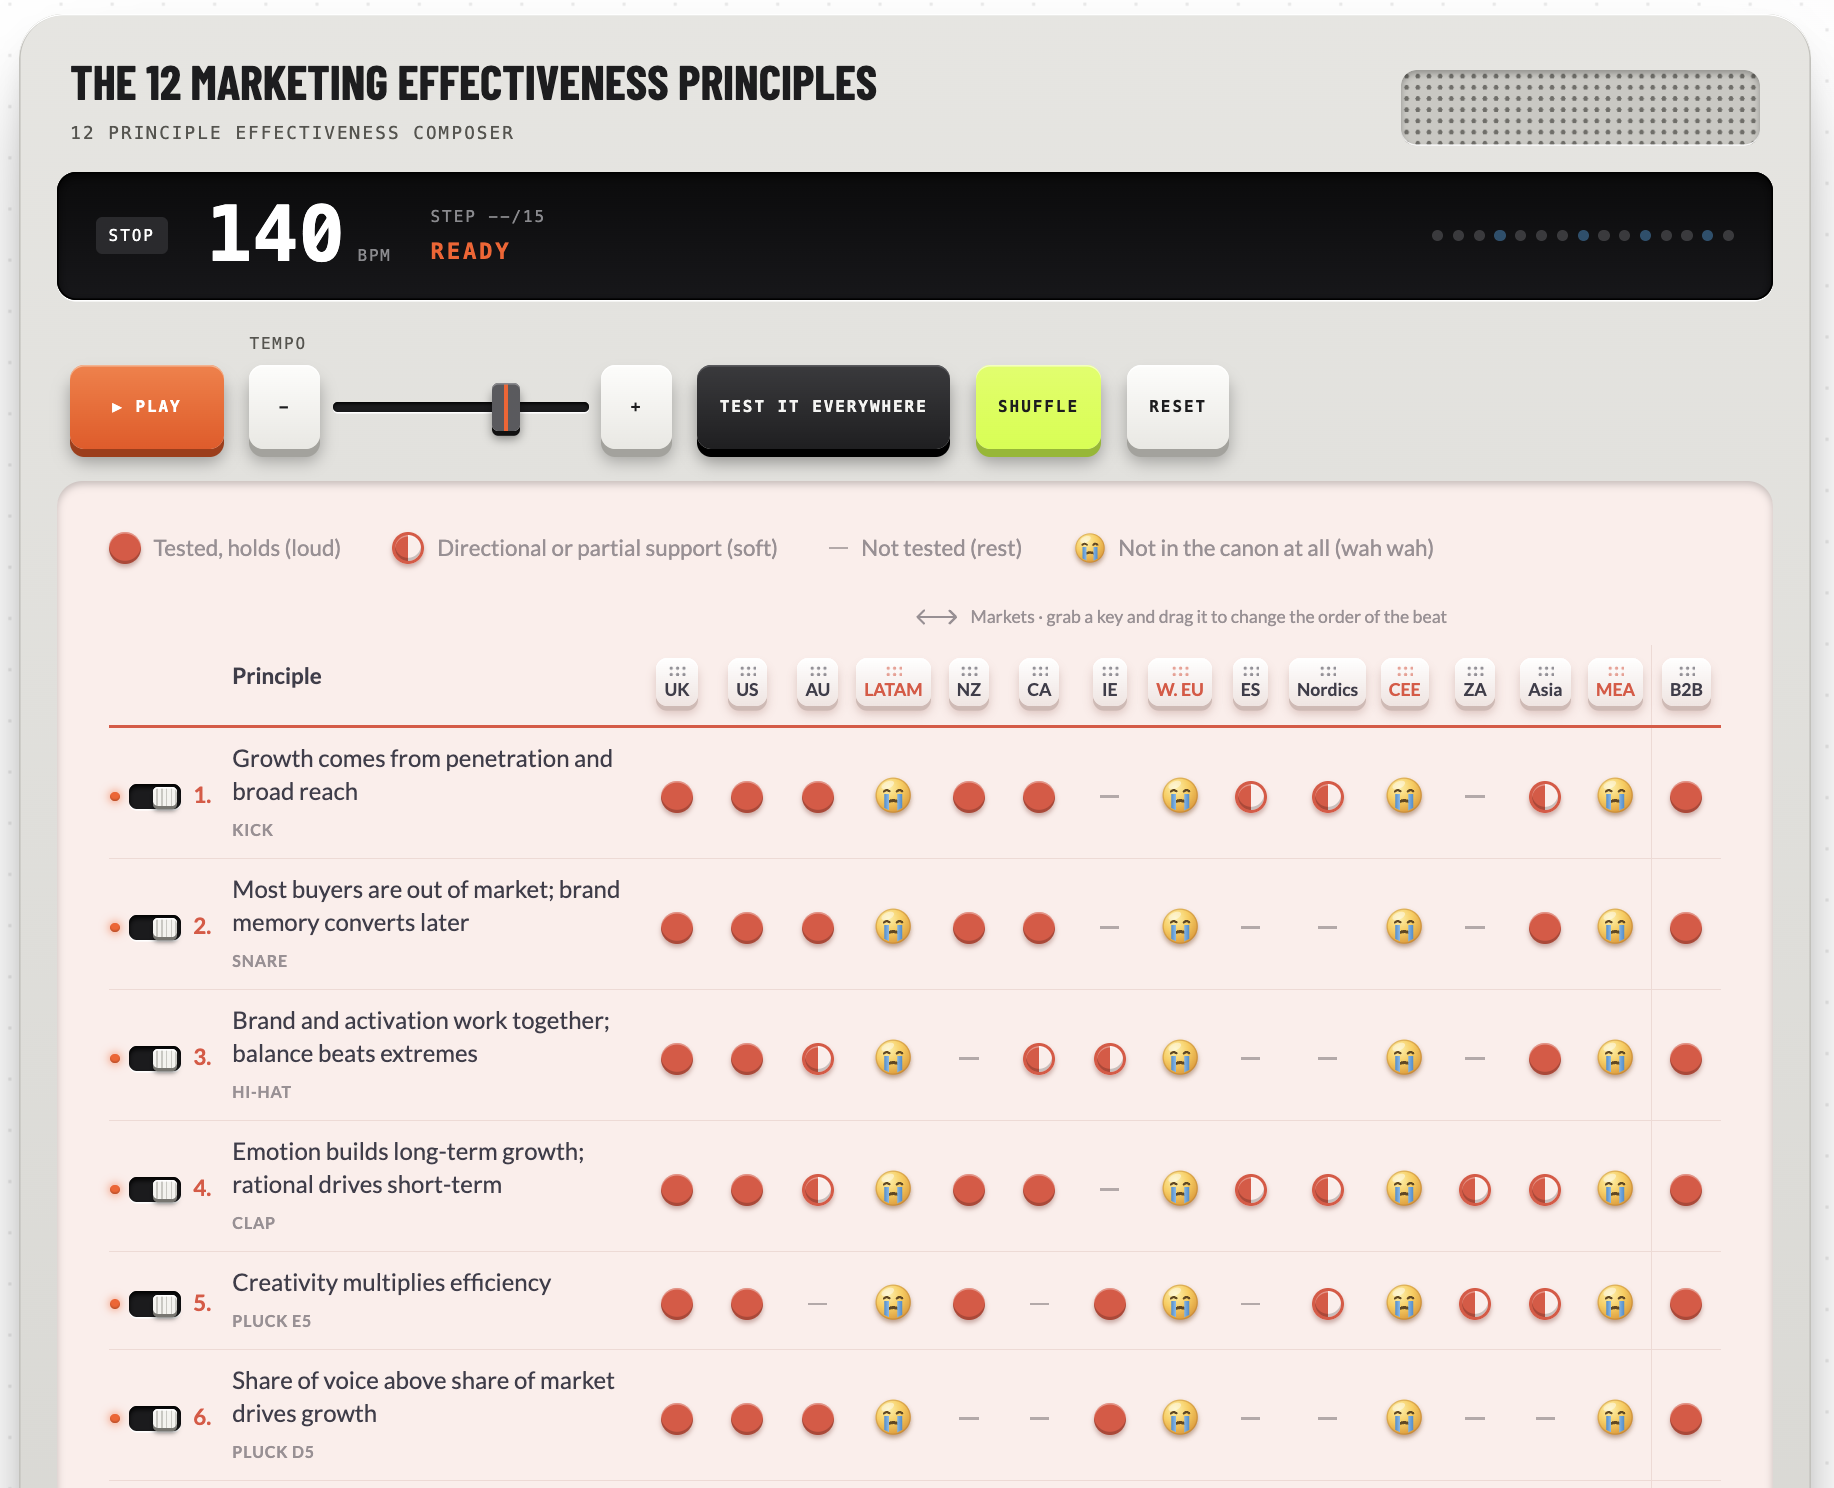
Those are two different briefs, and only one of them is winnable for a brand nobody was primed for. A search ad can close a sale that years of brand building opened. It has a much harder time opening one. This is the same division of labour Tom Roach describes as bothism, now with a percentage attached.
Some people are not listening, and they are the good customers
The second idea in the paper is receptivity. People differ in how open they are to marketing at all, and the distribution has a lump at each end.
An average of 23% of category buyers are unreceptive. Very few channels demonstrably move them. That sounds like an audience to write off, and the paper argues the opposite. If you manage to prime them, they are less likely to be pulled away by a competitor later. Reach them for the first time when they are already shopping and your chances are, in the paper's phrase, "vanishingly small".
At the other end, the most receptive 10% will respond to just about anything you put in front of them. They are easy to over-expose and their loyalty is brief. The paper compares them to the 15% of people who click on ads. A plan built around the people who respond to everything is a plan built for the wrong people.
Which four touchpoints?
The third idea is that touchpoints are not interchangeable buckets of reach.
Source: How Humans Decide, WPP Media and Saïd Business School, University of Oxford, 2025
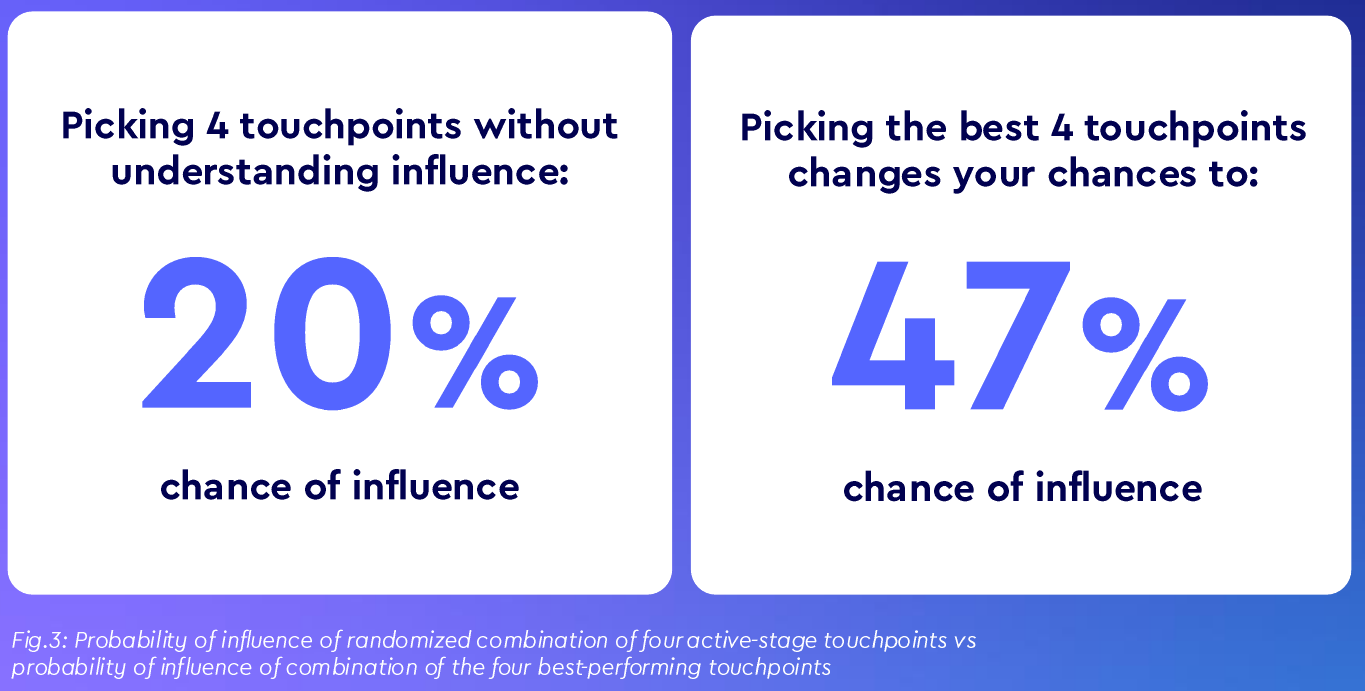
Pick four active-stage touchpoints without knowing which ones work in your category and you have a 20% chance of influencing the buyer. Pick the best four and it is 47%. Same number of touchpoints, more than double the odds. Which four are best changes by category, which is the paper's argument against universal media rules.
What closes the sale is mostly not an ad
When a primed buyer finally starts shopping, the channels that convert them are not the ones on the media invoice.
Source: How Humans Decide, WPP Media and Saïd Business School, University of Oxford, 2025
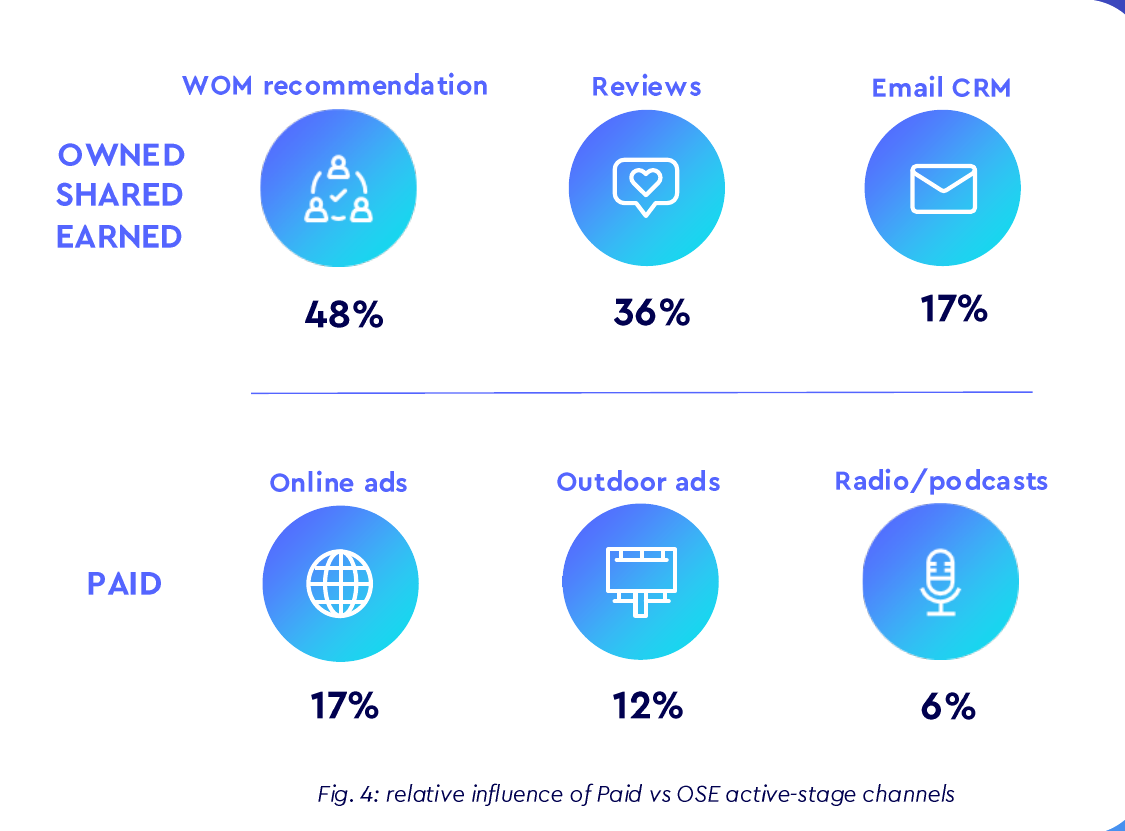
Word-of-mouth recommendation scores 48% on relative influence. Reviews score 36% and email CRM 17%. On the paid side, online ads score 17%, outdoor 12% and radio and podcasts 6%. On average the owned, shared and earned channels are nearly three times as influential as paid at this stage.
The paper's reading is that paid media builds the bias and the other three convert it. That makes a plan with no line for reviews or recommendations only half a plan.
How much weight to put on it
Some, with care. WPP Media sells media planning, and a study concluding that planning should be more sophisticated is not a shock from that address. The numbers come from online surveys in which people recall their most recent purchase and rate what influenced them. That is memory and self-report, not observed behaviour.
Against that, the sample is enormous, the academic partner is a serious one, and the conclusion matches a long line of effectiveness research in the Marketing Wisdom library.
The useful move is small. Take your last quarter's conversions and ask how many of those buyers had never heard of you before the week they bought. If you cannot answer, that is the first thing to measure.
If the answer is "hardly any", your performance team is doing its job. It is also telling you who did the other one.